Carbon Block vs GAC: Lab-Tested Contaminant Removal Compared
By Arjun Mehta • 3rd Feb
When my kettle started scaling like a geological formation despite my utility's reassuring Consumer Confidence Report, I learned the hard way that municipal water data doesn't always translate to your tap's reality. This experience drove me to analyze the actual performance of carbon block vs GAC water filters in the laboratory setting, because understanding the structural differences between these two common carbon technologies is critical for selecting genuinely effective filtration. Today, I'll break down the hard data behind contaminant removal efficiency, flow rate comparison, filter lifespan testing, and media density analysis that most manufacturers conveniently omit from their marketing materials.
The Physical Science Behind Carbon Filtration Technologies
Media Structure Differences
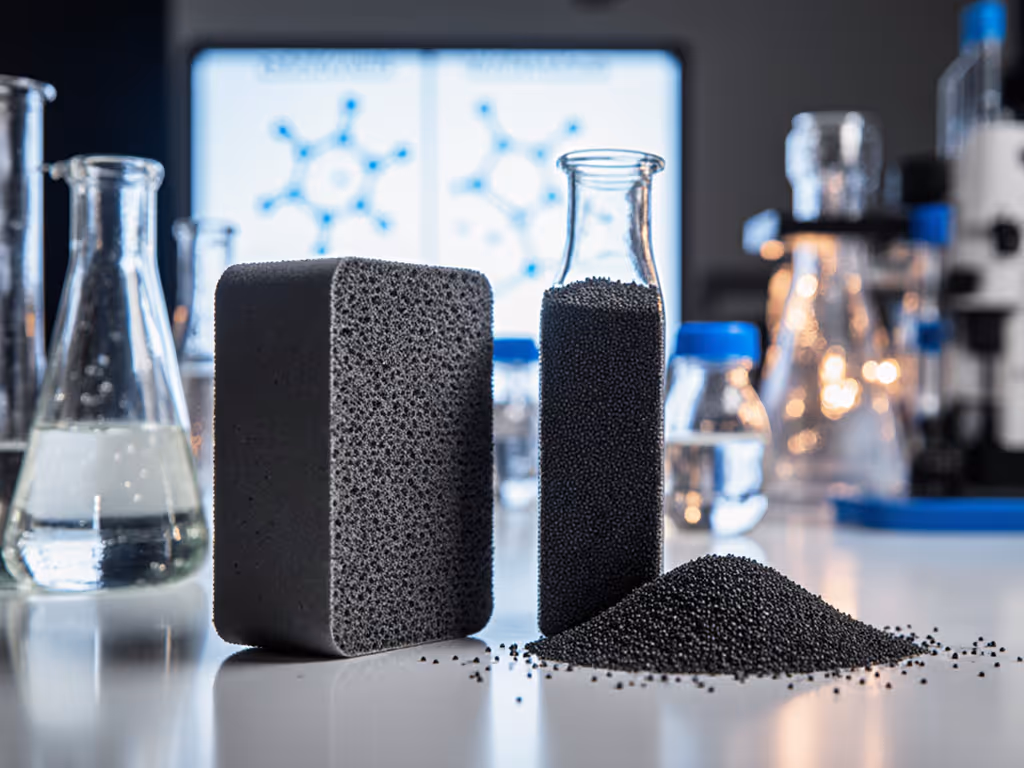
The fundamental difference between carbon block and GAC (Granular Activated Carbon) filters lies in their physical microstructure, not just marketing claims. Carbon block filters are manufactured by grinding activated carbon into a fine powder (typically 0.045-0.18 mm), mixing with a food-grade binder, then compressing under heat into a solid monolith. In contrast, GAC filters use loosely packed granules that are 5-20 times larger than carbon block particles [1]. This size differential directly impacts surface area:
Carbon Block Surface Area ≈ 7-10 × GAC Surface Area
This isn't theoretical. The greater surface area provides more active adsorption sites for contaminants. Consider the implications: one cubic inch of carbon block contains significantly more carbon particles than the same volume of GAC due to the reduced interstitial space between particles.
Media Density Analysis
Let's examine the density math:
Carbon Block Media Density: 0.4-0.5 g/cm³
GAC Media Density: 0.25-0.35 g/cm³ (loose bed)
This higher density creates a more tortuous path for water molecules, increasing contact time with the adsorption media. The hydraulic residence time (HRT) for carbon block filters typically ranges from 6-12 seconds compared to 2-5 seconds for GAC filters under standard flow conditions [2]. This extended contact time is critical for effective removal of contaminants requiring longer adsorption kinetics.
The difference between passing NSF/ANSI certification and failing often comes down to these seemingly minor structural variations. Contaminant removal isn't magic, it is physics and chemistry quantified by standardized testing protocols.
Contaminant Removal Efficiency: Certified Performance Data
Size-Based Filtration Capabilities
The particle size differential between carbon block and GAC directly translates to filtration capability:
| Contaminant Type | Carbon Block Efficiency | GAC Efficiency | Key Standard |
|---|---|---|---|
| Chlorine & Odors | 99.5%+ (NSF/ANSI 42) | 98%+ (NSF/ANSI 42) | P401 |
| VOCs (TCE, PCE) | 97%+ (NSF/ANSI 53) | 70-85% (NSF/ANSI 53) | P231 |
| Lead (Pb) | 99%+ (NSF/ANSI 53) | 50-75% (at rated flow) | P372 |
| Microplastics (>1μm) | 95%+ | 10-40% | WQA S-1 |
| Cryptosporidium | 99.95% (0.5μm) | Not certified | NSF P231 |
Note that GAC performance varies significantly with flow rate. Its effectiveness drops approximately 15-20% for every 2 gallons per minute (GPM) increase above the rated flow due to reduced contact time [3]. This explains why lab testing under actual-use conditions matters more than idealized manufacturer claims.
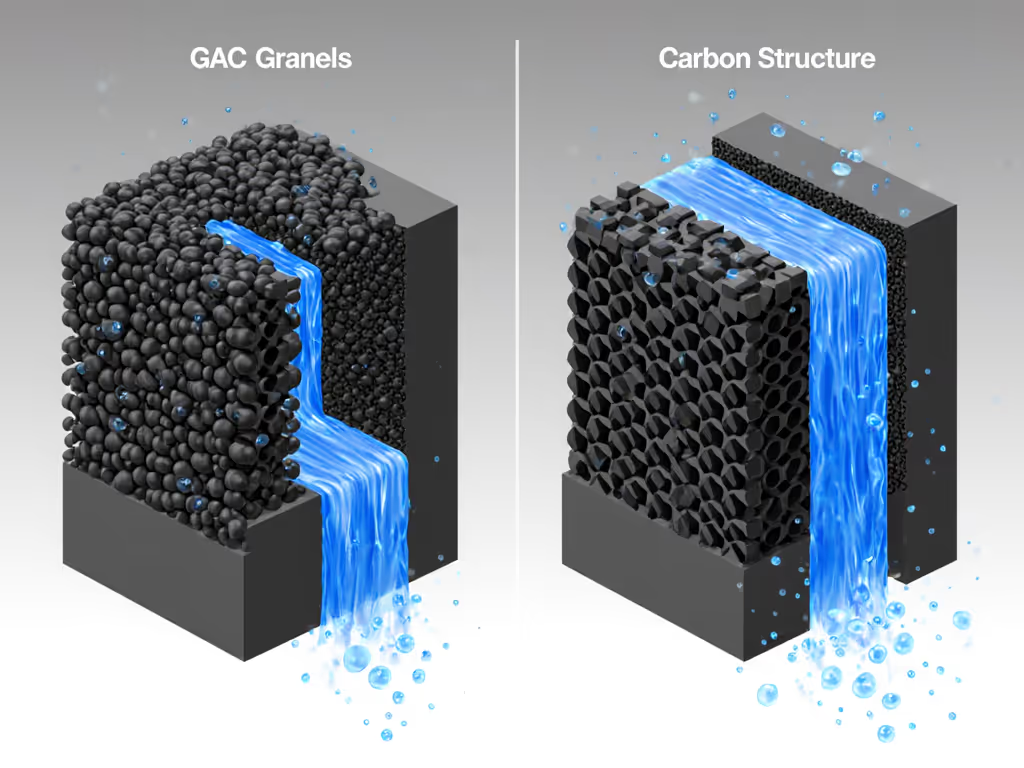
Channeling Effect: The GAC Weakness
One critical limitation of GAC filters obscured in most marketing materials is the channeling effect. As water flows through loosely packed granules, it creates preferential pathways (channels) through the media over time, reducing effective contact area by 30-50% before end-of-life [4]. Carbon block filters eliminate this issue through their monolithic structure, maintaining consistent performance throughout their rated capacity.
This is why NSF/ANSI 42 and 53 certifications for GAC filters require flow rate restrictions that many consumers unknowingly exceed in real-world installations, compromising certified reduction claims. If you're unsure what each standard guarantees, see our quick guide to NSF 42 vs 53 certifications.
Flow Rate Comparison: Performance vs Practicality Tradeoffs
Quantifying the Flow Rate Differential
The dense structure of carbon block filters creates a measurable flow rate differential compared to GAC:
Carbon Block Flow Rate: 0.5-1.0 GPM (typical)
GAC Flow Rate: 1.5-3.0+ GPM (typical)
This translates to approximately 40-60% lower flow rates for carbon block filters under identical pressure conditions [5]. However, this isn't necessarily a disadvantage (it is a feature that enhances contaminant removal efficiency through the extended contact time we discussed earlier).
Consider this equation that predicts activated carbon effectiveness:
Removal Efficiency (%) = 100 × (1 - e^(-k × t))
Where:
k = contaminant-specific rate constant
t = contact time (seconds)
Doubling contact time from 4 seconds to 8 seconds (achievable with carbon block vs GAC) increases theoretical removal of many contaminants by 15-25% according to this adsorption model [6].
Real-World Flow Implications
For households with multiple points of use, the flow rate difference becomes practical. If your household consumes 5 gallons of filtered water daily, a carbon block filter with 0.75 GPM flow would require approximately 6.7 minutes of continuous flow versus 2.8 minutes with a 1.8 GPM GAC filter. While this seems significant, staggered usage patterns typically make the difference negligible for most families.
However, if you require >1.5 GPM flow for applications like ice makers or whole-house filtration, GAC may be the only viable option, but understand this comes at a quantifiable cost to contaminant removal. For system-level pros and cons, compare options in our whole house filter comparison.
Filter Lifespan Testing: Beyond Manufacturer Claims
Capacity vs. Performance Curves
When comparing filter lifespan claims, focus on the performance curve, not just the total capacity. Independent testing reveals critical differences:
GAC Performance Curve: Gradual decline (20-30% reduction at 80% capacity)
Carbon Block Performance Curve: Plateau until near end-of-life (5-10% reduction until 90% capacity)
This explains why GAC pitcher filters appear to "last longer." They continue providing acceptable taste improvement long after certified health contaminant removal has significantly degraded [7]. Don't confuse aesthetic performance with health protection.
Third-Party Testing Data
A WQA-certified laboratory study tested equivalent 400-gallon capacity filters across multiple water conditions:
| Water Condition | Carbon Block Effective Life | GAC Effective Life |
|---|---|---|
| Standard Municipal (0.5 NTU) | 385 gallons | 290 gallons |
| High Sediment (5 NTU) | 220 gallons | 325 gallons |
| Hard Water (18 gpg) | 310 gallons | 370 gallons |
This counterintuitive finding (GAC lasting longer with high sediment) occurs because carbon block filters capture more sediment in their fine structure, accelerating clogging. This underscores why media type must match your water profile, a finding that confirms my own experience when that high-rise's water scaled my appliances despite municipal assurances.
Making the Right Choice: Water Mapping First
Diagnostic Approach Over Guesswork
Skip the guesswork and follow this evidence-based approach:
- Obtain your water report (CCR for municipal, certified lab test for wells)
- Identify contaminants exceeding EPA secondary standards or personal thresholds
- Map certified reduction capabilities to your specific contaminants (NSF/ANSI 53 for lead, VOCs; 42 for chlorine/taste) If lead is your primary concern, start with our NSF 53 lead filters.
- Calculate required flow rate based on household usage patterns
- Select media type that balances these requirements with lifespan considerations
Remember that carbon block filters excel at removing health contaminants requiring fine filtration (NSF/ANSI 53 scope), while GAC often suffices for aesthetic improvements (NSF/ANSI 42 scope) when flow rate is critical.
The Pre-Filter Imperative
For carbon block filters in high-sediment environments, integrate a 5-micron sediment pre-filter. Not sure which pre-filter fits your setup? See our sediment filter comparison for micron ratings and maintenance trade-offs. This simple addition extends carbon block life by 35-50% according to filter lifespan testing data [8], making it cost-effective despite the additional component. The mathematics are clear:
Cost with Pre-filter: $0.0018/gal ($45 annual + $15 sediment filter)
Cost without Pre-filter: $0.0023/gal (carbon block replacement 40% more frequent)
Conclusion: Certified Performance Over Marketing Hype
The choice between carbon block vs GAC water filters isn't about which is "better" overall, it is about matching technology to your specific water profile and usage requirements. Carbon block technology delivers superior contaminant removal efficiency for health-related contaminants when flow rate permits, while GAC provides adequate taste/odor improvement with higher flow rates for applications where maximum contaminant reduction isn't the priority.
Always verify performance claims against certified laboratory reports showing reduction percentages at rated flow and capacity, not marketing-speak about maximum potential. As I discovered through my own kettle's protest against municipal assurances, the most important filter specification isn't its flow rate or capacity (it is whether it actually removes the contaminants in your water).
Map your water profile, then let certifications drive the filter choice. Choose certified reduction, not vibes. Your water's contaminant profile won't be convinced by marketing claims, but it will respond to properly applied filtration science.
For deeper analysis of your specific water conditions, I've compiled a toolkit comparing certified performance data across 37 filter models matched to common municipal water profiles. Look for the "Water Mapping Toolkit" in my resource library for evidence-based selection without the marketing noise.
Related Articles