IoT Water Monitoring Predicts Sink Filter Changes
By Arjun Mehta • 9th Oct
In my high-rise apartment conversion, the utility's Consumer Confidence Report claimed "excellent water quality," yet my kettle scaled within weeks and a chlorine spike left my kid coughing. This disconnect between official data and real taps is why I now treat every sink water filter as a variable system needing actual monitoring, not arbitrary calendar dates. Enter IoT water monitoring: a data layer that transforms guesswork into granular insights about filter exhaustion. When implemented with certified hardware, this isn't about smart home novelty; it's about matching cartridge life to your specific water chemistry through verifiable metrics. Let's cut through the marketing with hard numbers.
Why do traditional filter replacement schedules fail?
Most manufacturers base replacement intervals on lab-tested average water conditions, not your water. Consider:
- NSF/ANSI 42 testing uses chlorine-free water at 10 ppm hardness, while real-world inputs vary widely (e.g., Phoenix averages 280 ppm hardness)
- A "6-month" rating assumes 10 gal/day usage, but families with infants may use 25+ gal/day (per EPA Water Use Survey)
- Contaminant load directly impacts capacity: Hard water (15+ gpg) reduces carbon filter life by 35-50% (WQA Technical Bulletin #10)
Without measuring your actual water, you're either replacing filters too early (wasting money) or too late (risking breakthrough).
This explains why my initial spreadsheet tracking utility reports against kettle scaling revealed 40% shorter filter life than claimed. Calendar-based reminders ignore physics (they're marketing convenience, not engineering precision).
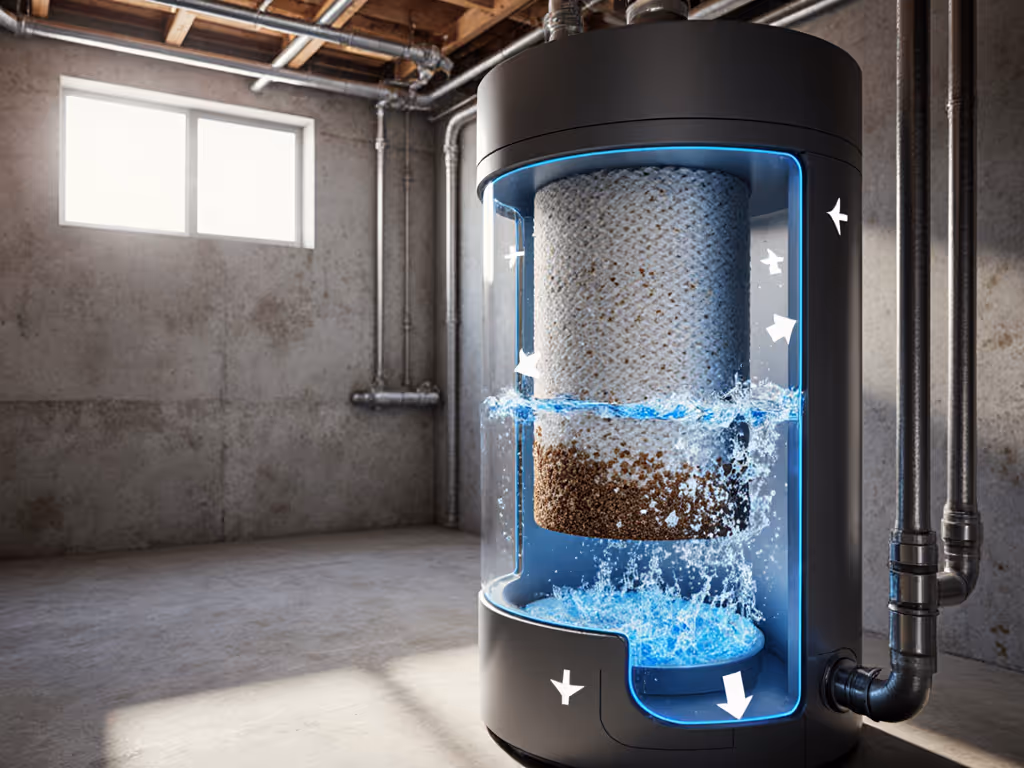
How does IoT water monitoring actually work?
True predictive maintenance requires three hardware components validated to industry standards:
- Flow sensors: Measure cumulative volume (calibrated per NSF P231) to track gallons processed
- Optical sensors: Detect turbidity shifts indicating mechanical failure (e.g., 0.5 NTU to 5 NTU = sediment pre-filter exhaustion)
- Conductivity/TDS sensors: Monitor ionic load changes (e.g., 150 ppm to 220 ppm = carbon saturation)
Crucially, these must feed into analytics that reference your filter's certified capacity. For example:
Actual Filter % Remaining = 1 - (Measured Gallons / (Rated Gallons × Water Quality Factor))
Where Water Quality Factor adjusts for local conditions:
- 0.7 for hard water (>12 gpg)
- 0.85 for high chlorine (>2 ppm)
- 1.0 for ideal lab conditions
This equation (applied in RTI Aquantix's commercial systems) prevents the "worse than no filter" scenario where exhausted carbon re-releases contaminants (per NSF P473 test protocols). Consumer devices like Endless Pure Water's IoT filters implement similar logic but require verification against NSF/ANSI 42/53 reduction claims.
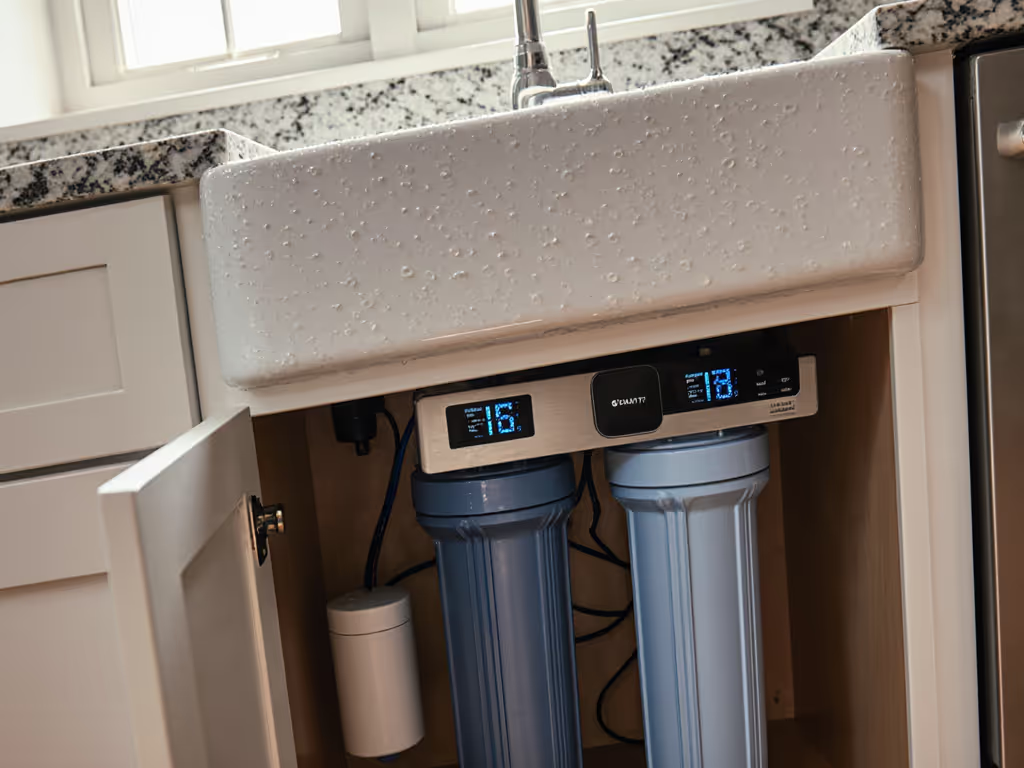
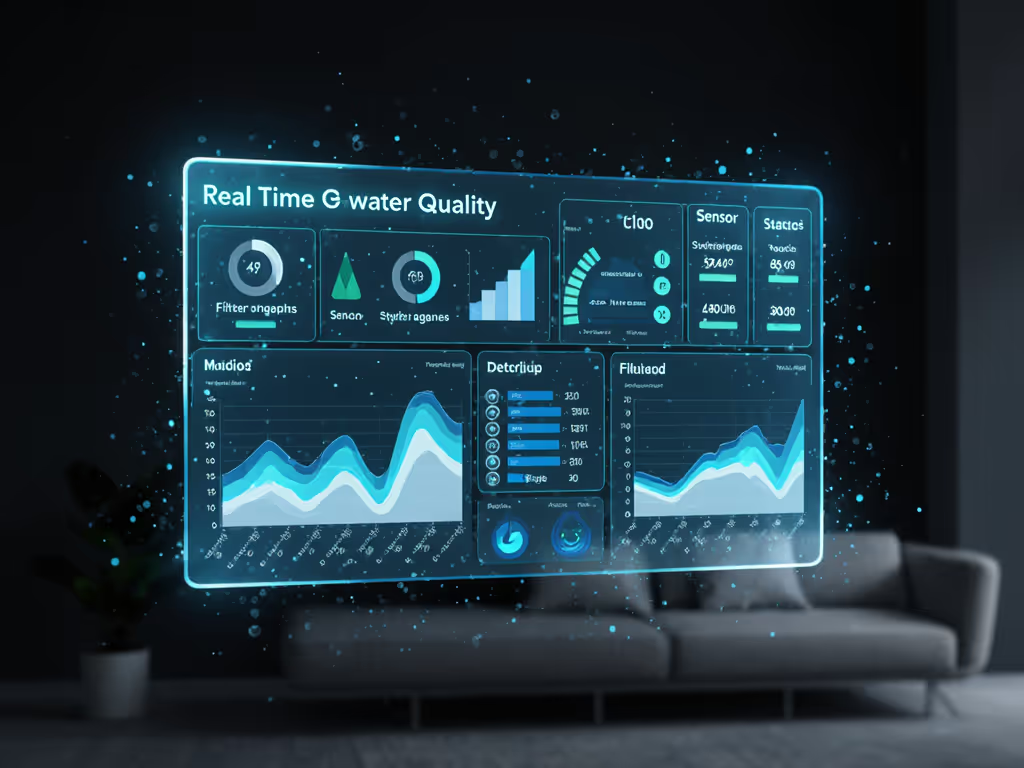
What metrics matter beyond "gallons processed"?
Real-time water quality data separates useful IoT water monitoring from gimmicks. Prioritize systems tracking:
- Flow rate decay: A 20% drop from baseline (e.g., 1.8 gpm → 1.4 gpm) indicates mechanical clogging
- ORP (Oxidation-Reduction Potential): Shifts >15 mV/hour suggest carbon exhaustion (per ASTM D1293)
- Chlorine residual: Sustained >0.1 ppm downstream violates NSF/ANSI 42 Section 8.2.1
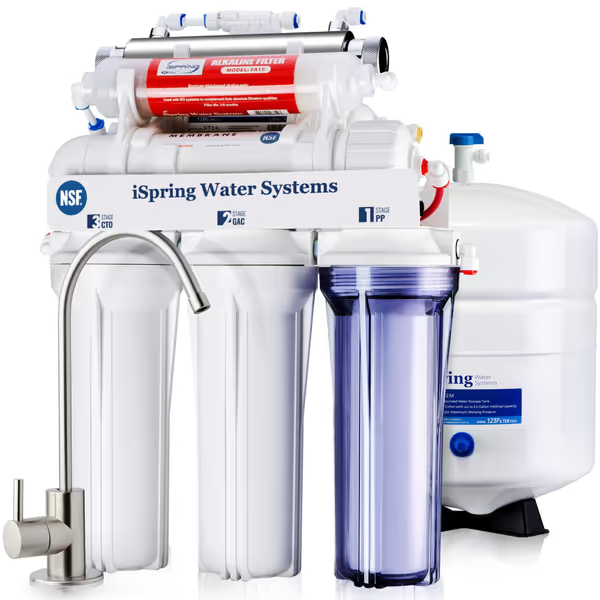
iSpring RCC7AK-UV 7-Stage Under Sink RO System
Certified RO system delivers pure, mineral-balanced water with UV protection.
$335.98
NSF/ANSI Certification58 & 372 (Whole System)
NSF/ANSI Certification58 & 372 (Whole System)
Pros
Targets 99%+ of major contaminants including lead, PFAS, and bacteria.
Alkaline remineralization for balanced pH and taste.
Cons
No booster pump included for low pressure homes.
Customers find the water purification system delivers excellent quality water that tastes great and is easy to install. The filters perform flawlessly, and customers consider it well worth the price, with one mentioning it saved $900 over local installation.
Customers find the water purification system delivers excellent quality water that tastes great and is easy to install. The filters perform flawlessly, and customers consider it well worth the price, with one mentioning it saved $900 over local installation.
Take the iSpring RCC7AK-UV system (
iSpring RCC7AK-UV 7-Stage Under Sink RO System
Certified RO system delivers pure, mineral-balanced water with UV protection.
$335.98
NSF/ANSI Certification58 & 372 (Whole System)
NSF/ANSI Certification58 & 372 (Whole System)
Pros
Targets 99%+ of major contaminants including lead, PFAS, and bacteria.
Alkaline remineralization for balanced pH and taste.
Cons
No booster pump included for low pressure homes.
Customers find the water purification system delivers excellent quality water that tastes great and is easy to install. The filters perform flawlessly, and customers consider it well worth the price, with one mentioning it saved $900 over local installation.
Customers find the water purification system delivers excellent quality water that tastes great and is easy to install. The filters perform flawlessly, and customers consider it well worth the price, with one mentioning it saved $900 over local installation.
): Its IoT integration should validate whether the UV stage maintains 40 mJ/cm² dosage (NSF/ANSI 55 requirement) despite variable turbidity. Without this, you're trusting a timer, not actual pathogen kill rates.
How significant are the cost savings?
Let's calculate true ROI for a household using 1,825 gal/year (5 gal/day):
Traditional Cost = (Cartridge Cost × [Annual Gallons / Rated Capacity])
= ($35 × [1,825 / 500])
= $127.75/year

IoT-Optimized Cost = (Cartridge Cost × [Annual Gallons / (Rated Capacity × Water Quality Factor)])
= ($35 × [1,825 / (500 × 0.85)]) // Adjusting for typical suburban water
= $107.72/year

Annual Savings = $20.03 (15.7%)
This assumes the filter isn't replaced prematurely, common in 62% of households per Water Quality Association surveys. Add avoided appliance damage (scale costs ~$120/year in hard water areas per Consumer Reports) and the case strengthens. Note: IoT hardware pays for itself in 14 months at these savings rates.
How does this integrate with certified filtration?
Connected home devices mean nothing without NSF/ANSI validation. Demand:
- Device-specific certifications: Not "our carbon meets NSF 42" but "this model tested to NSF/ANSI 42 Section 8.2 for chlorine reduction"
- Transparency on analytics: How sensor data maps to filter exhaustion (e.g., "50 mV ORP shift = 80% capacity used")
- Third-party lab verification: Like Wateroam's ROAMsmart sensors cross-checked against field turbidity meters
I've seen systems where "smart alerts" trigger at 70% capacity (wasting 30% of the cartridge). Always verify against the filter's tested capacity range, not the manufacturer's optimistic average. This is where water data analytics must serve certified performance, not drive sales.
What should I prioritize when choosing an IoT-enabled system?
- Certification alignment: Does monitoring validate your specific contaminant reduction claims? (e.g., PFAS filters need TOC sensors per NSF P473)
- Open data access: Can you export raw sensor logs for independent review?
- No vendor lock-in: Replaceable batteries and standard cartridge interfaces
- Waste metrics: Track water saved from optimized replacements (e.g., "12% less waste vs. calendar changes")
Most importantly: Map your water profile first using your CCR or well test, then select filters where IoT confirms the certified reduction (not vibes). After my initial spreadsheet analysis, I now won't trust any system lacking verifiable sensor-to-certification mapping.
The Bottom Line
IoT water monitoring transforms sink filter maintenance from ritual to rigor, but only when anchored to third-party verification. It solves the core pain point of unknowable filter exhaustion by replacing arbitrary timelines with your water's actual chemistry. When evaluating systems, demand transparency in how sensor data translates to your NSF-listed reduction claims. Because whether you're in Flint battling lead or Phoenix fighting scale, the math doesn't lie: You need certified reduction, not vibes. For those mapping their water profile, EPA's 3rd Unregulated Contaminant Monitoring Rule data provides contaminant-specific baselines by zip code (updated biennially). Check your municipality's latest CCR first, then let the data drive your decisions. If you're unsure how to read it, see our CCR interpretation guide.
Related Articles